
Cracking the Code: Realtime Debugger Visualization Architecture – BSC 2025
My talk at the 2025 Better Software Conference.

I had the honor of speaking alongside many brilliant programmers at the Better Software Conference this year. The recording for my talk is now available—you can watch it here:
My talk focused on some of my work on the RAD Debugger over the past few years—specifically, that on the architecture of the debugger’s evaluation and visualization systems.
In my view, visualization is near the top of the priority list for debuggers, but most debugger material focuses on the implementation of core building blocks of debugger-debuggee interaction, like process control, stepping, breakpoints, and so on. This is understandable, because debuggers are an enormously vast problem space. But, seeing this as one of a debugger’s topmost priorities, and as something unique about debuggers that I’d spent a lot of time on, I tried to cover as much as possible about debugger visualization engine architecture within a ~1.5 hour window.
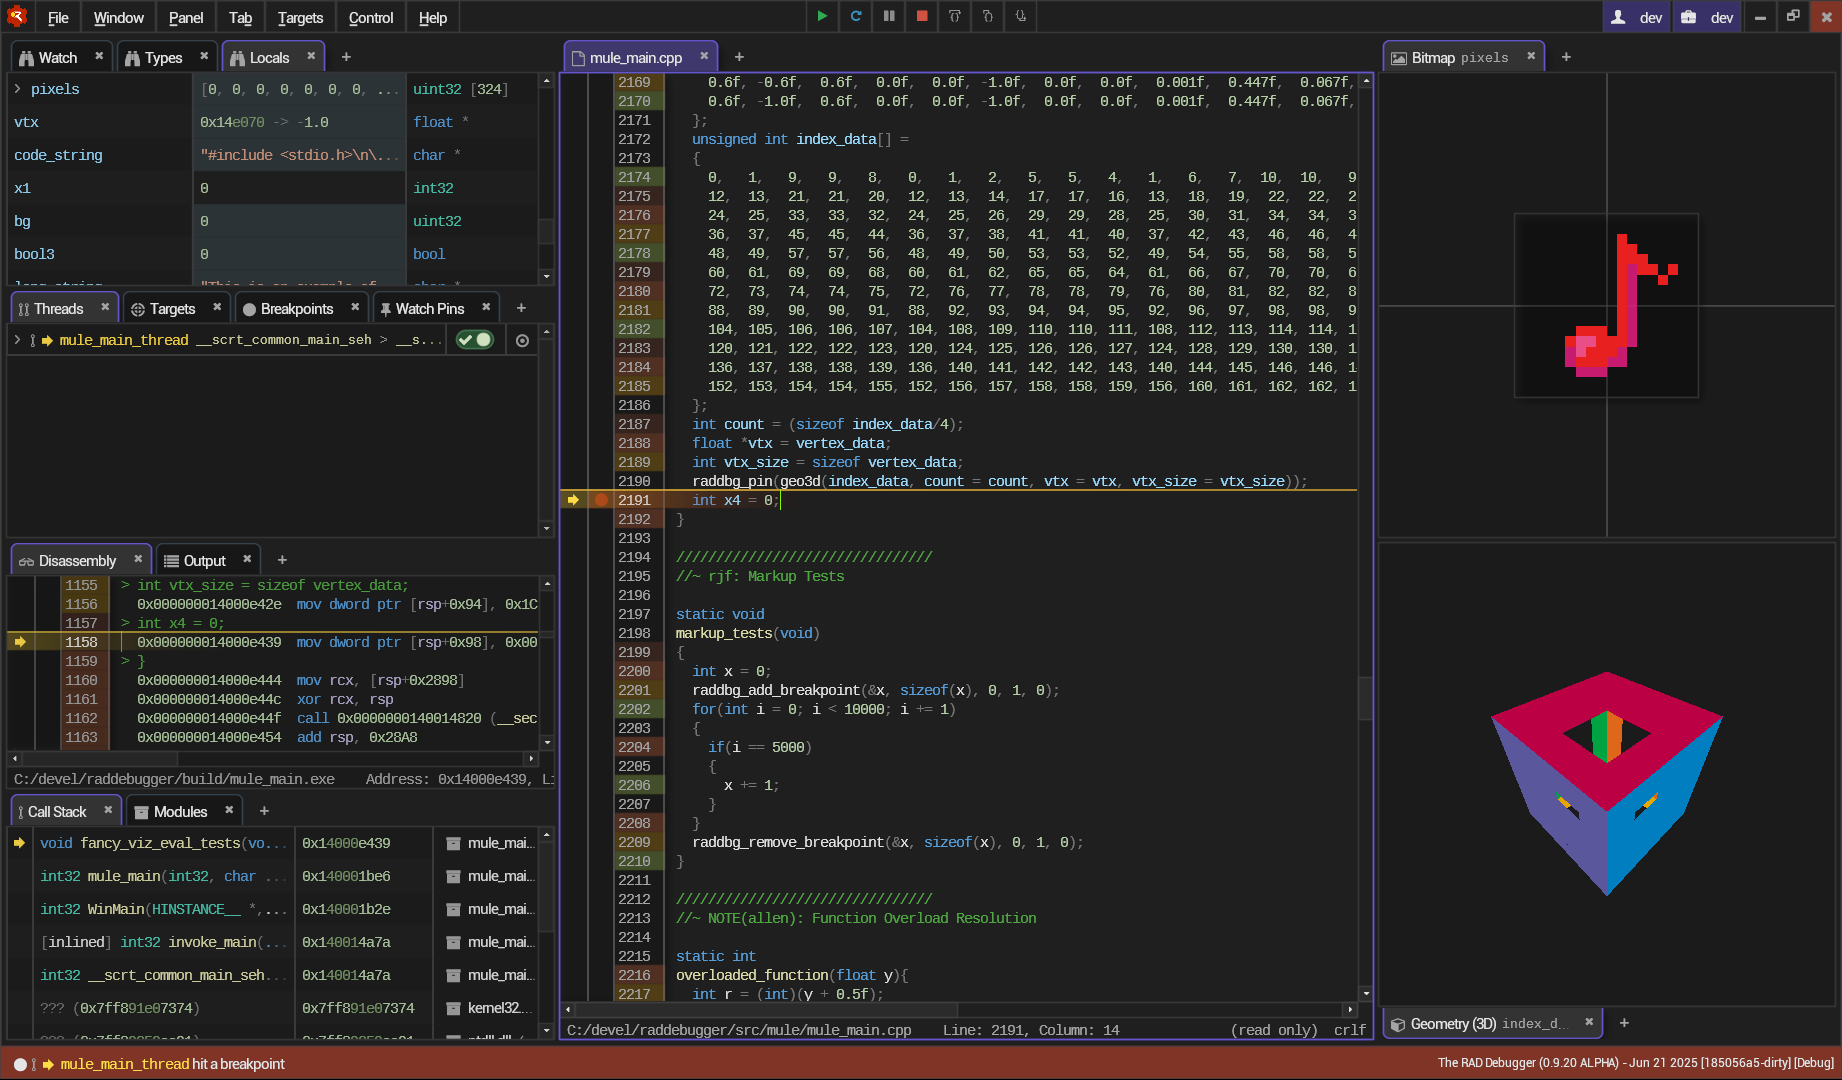
As it turns out, there’s a lot of ground to cover, so in the talk I walk through the basics of process control, debug information, and the compilation and interpretation pipeline a debugger contains for evaluation, and I follow that by digging a bit more deeply into the pipeline for visualizing evaluations in a variety of ways, from building an “infinite” watch window tree, to graphical visualizers:
I hope everyone enjoys the talk, and finds it interesting or useful!
-Ryan